Thought leadership
You wouldn't download a movie before watching it.

Kevan Barsky
April 29, 2026
•
5 min read

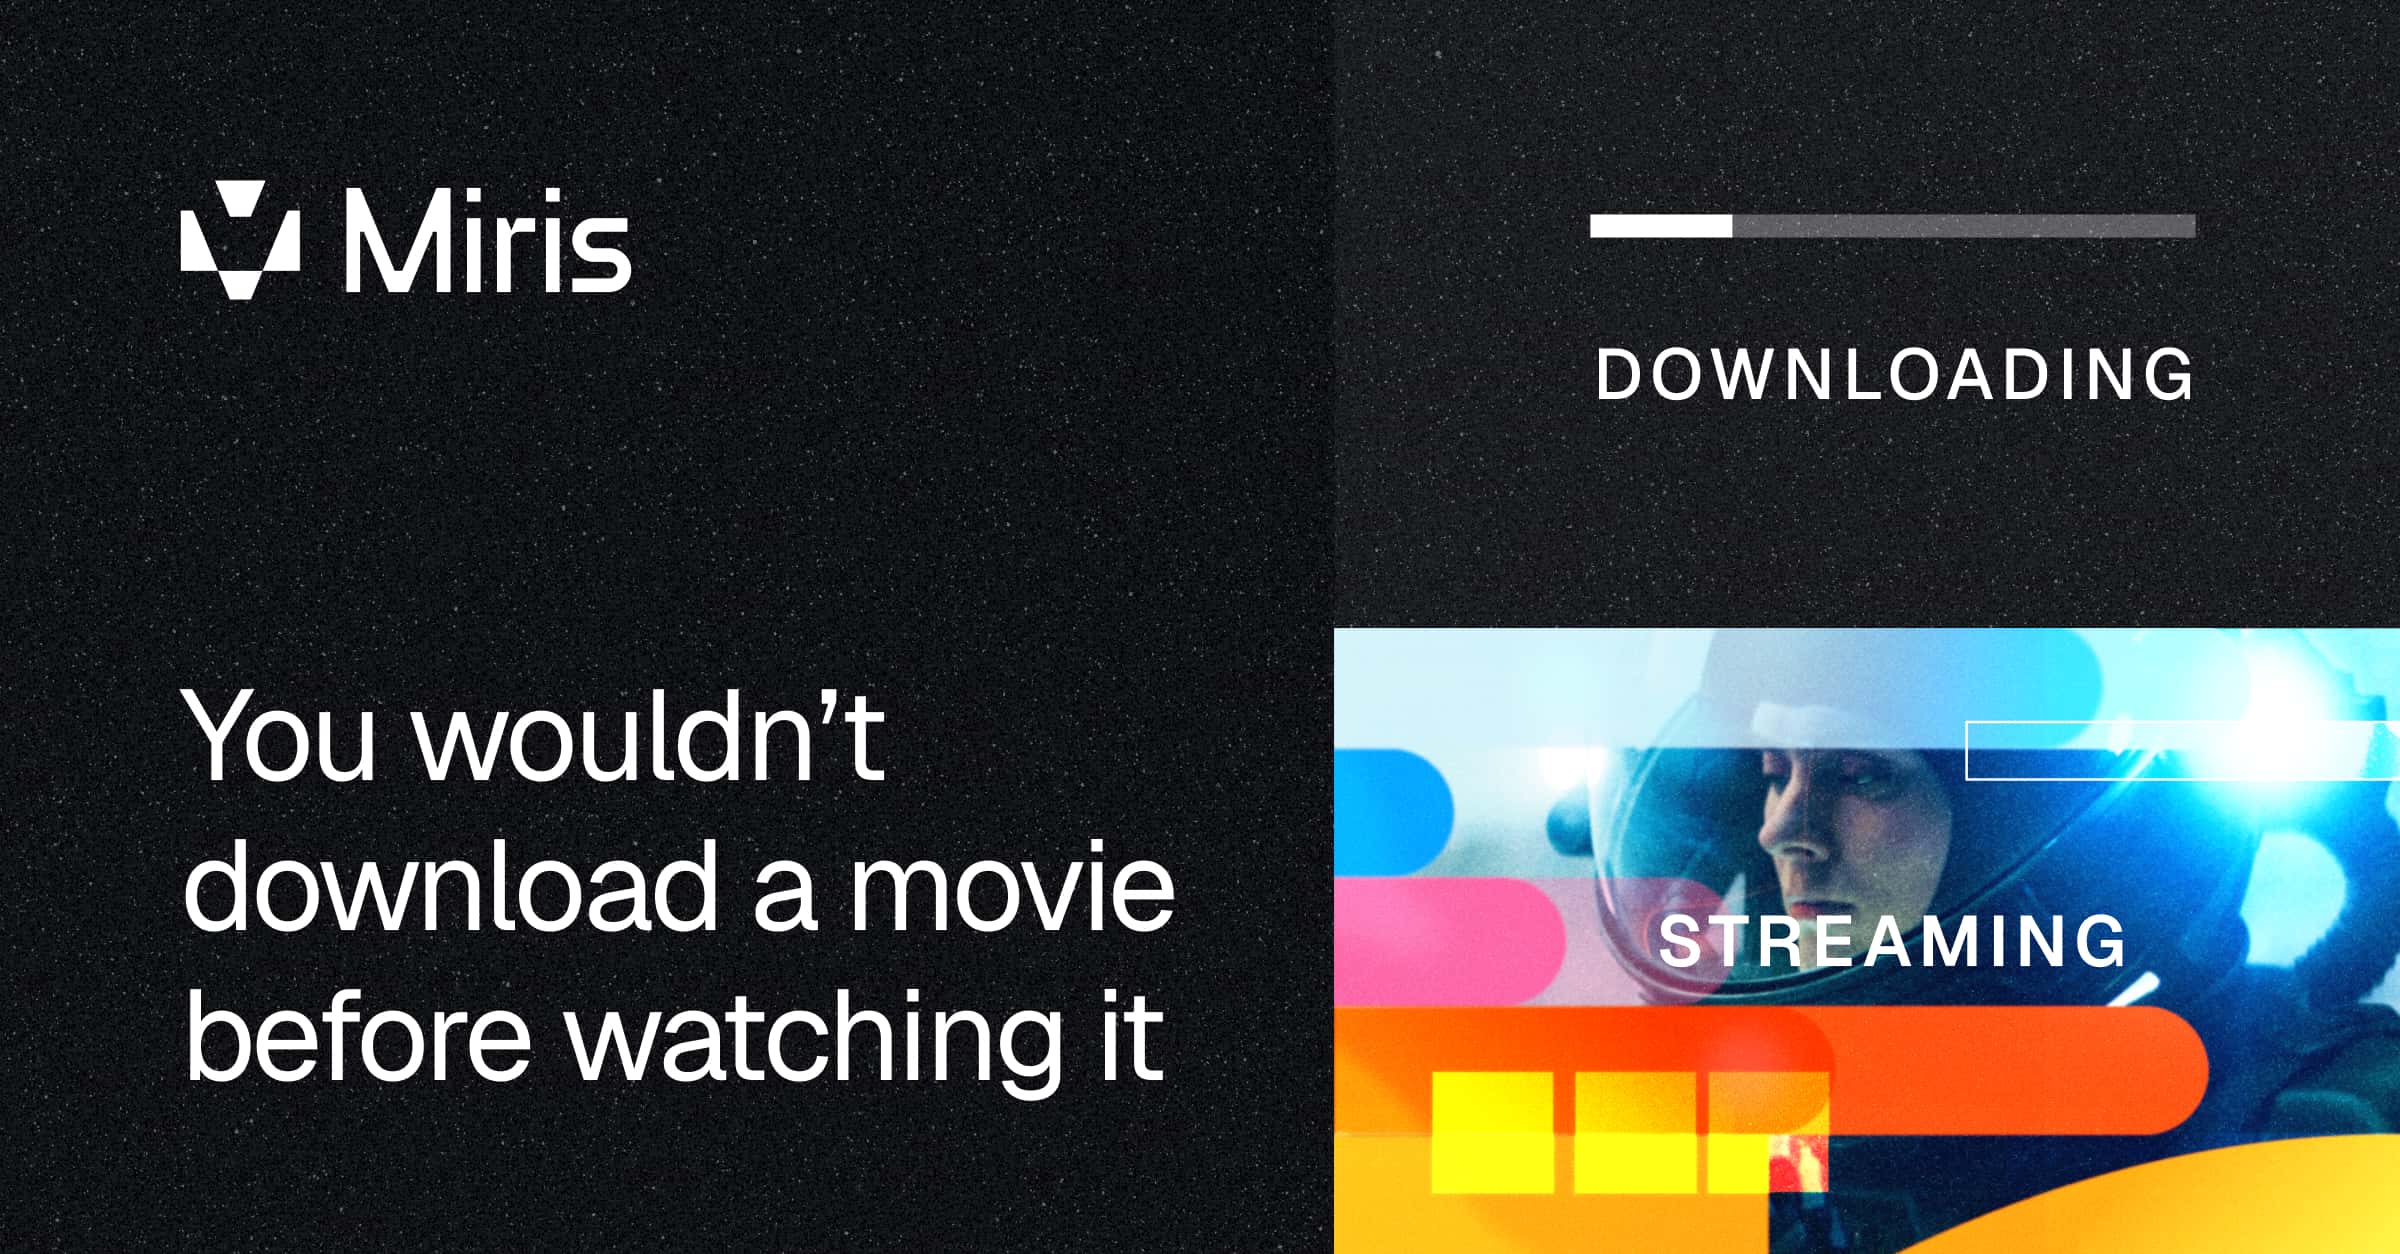
Video figured this out two decades ago. Streaming let YouTube and Netflix make content feel instant, because the experience begins before the file finishes arriving. 3D on the web never made that transition. It still works the way it did in 2005: download the whole model first, render second.
And there is a cost to that. In 1993, Jakob Nielsen of the Nielsen Norman Group published the canonical research on human attention during digital interactions. Three thresholds that still hold today:
Most 3D on the web lands well past the 10-second line. We built miris.com/vs to show what that actually costs, with numbers.
Same 3D asset, same connection, three different delivery approaches.
Traditional GLB (the binary version of glTF) is the naive baseline, and how most 3D on the web gets delivered today. GLB packages an entire 3D scene into a single binary download. Nothing renders until the last byte arrives. On a 490 MB asset, that lands tens of seconds out, well past Nielsen's 10-second attention limit, and it gets worse as network conditions get worse.
Draco-compressed GLB is the common workaround. Draco is Google's open-source geometry compressor, and most teams shipping 3D have already reached for it. It cuts the asset down substantially, in this case to 174 MB. First frame arrives faster than raw GLB. But the delivery model has not changed. The user is still waiting for a full file to transfer before anything renders, which means the first frame still lands on the wrong side of the 10-second line on most real-world connections.
Miris streams. The client requests what is visible, the server sends the minimum data required to render, and the scene goes live from the first few kilobytes. First frame lands in the hundreds of milliseconds, under Nielsen's 1-second flow threshold. The rest of the asset resolves in the background while the user is already navigating.
The exact numbers will vary by device, location, and connection. The shape of the gap does not. Across any reasonable test conditions, the three approaches sort into three different regions of Nielsen's thresholds:
Two of those three options have already failed by the time they render. One never triggers the failure mode. The point of the demo is not to promise you a specific millisecond count. It is to let you run it on your own device, your own connection, and confirm which side of the 1-second and 10-second lines each approach actually lands on.
Interactivity starts immediately. Users orbit, zoom, and explore the asset while higher-resolution detail keeps loading in. That is not a shorter progress bar. It is a fundamentally different interaction model, closer to how video streaming works than to how 3D has worked historically.
Mobile stops being a compromise. When your first frame is 12 MB instead of 490, slow LTE and patchy 5G stop being constraints you have to design around. High-fidelity content becomes something you ship, not something you strip down for smaller screens.
Fidelity stops being a liability. Bigger, better-captured assets no longer mean a worse user experience. They mean more detail resolving progressively as the user engages.
Go to miris.com/vs, hit Start Demo, and run it on 5G mobile. Watch where each option lands against the 1-second and 10-second thresholds.
The loading bar had a good run. It's time to retire it.
Source: Nielsen, J. (1993). Response Times: The 3 Important Limits. Nielsen Norman Group. nngroup.com/articles/response-times-3-important-limits